Trusted by over 100 of the world's biggest companies


Why operational visibility is difficult to maintain
Many organisations rely on manual reporting processes to understand operational performance. Without integrated analytics, leadership teams struggle to gain real-time insight into delivery performance.
How Retain delivers operational intelligence
Retain connects operational planning data with reporting dashboards, allowing organisations to analyse delivery performance and workforce capacity in real time.
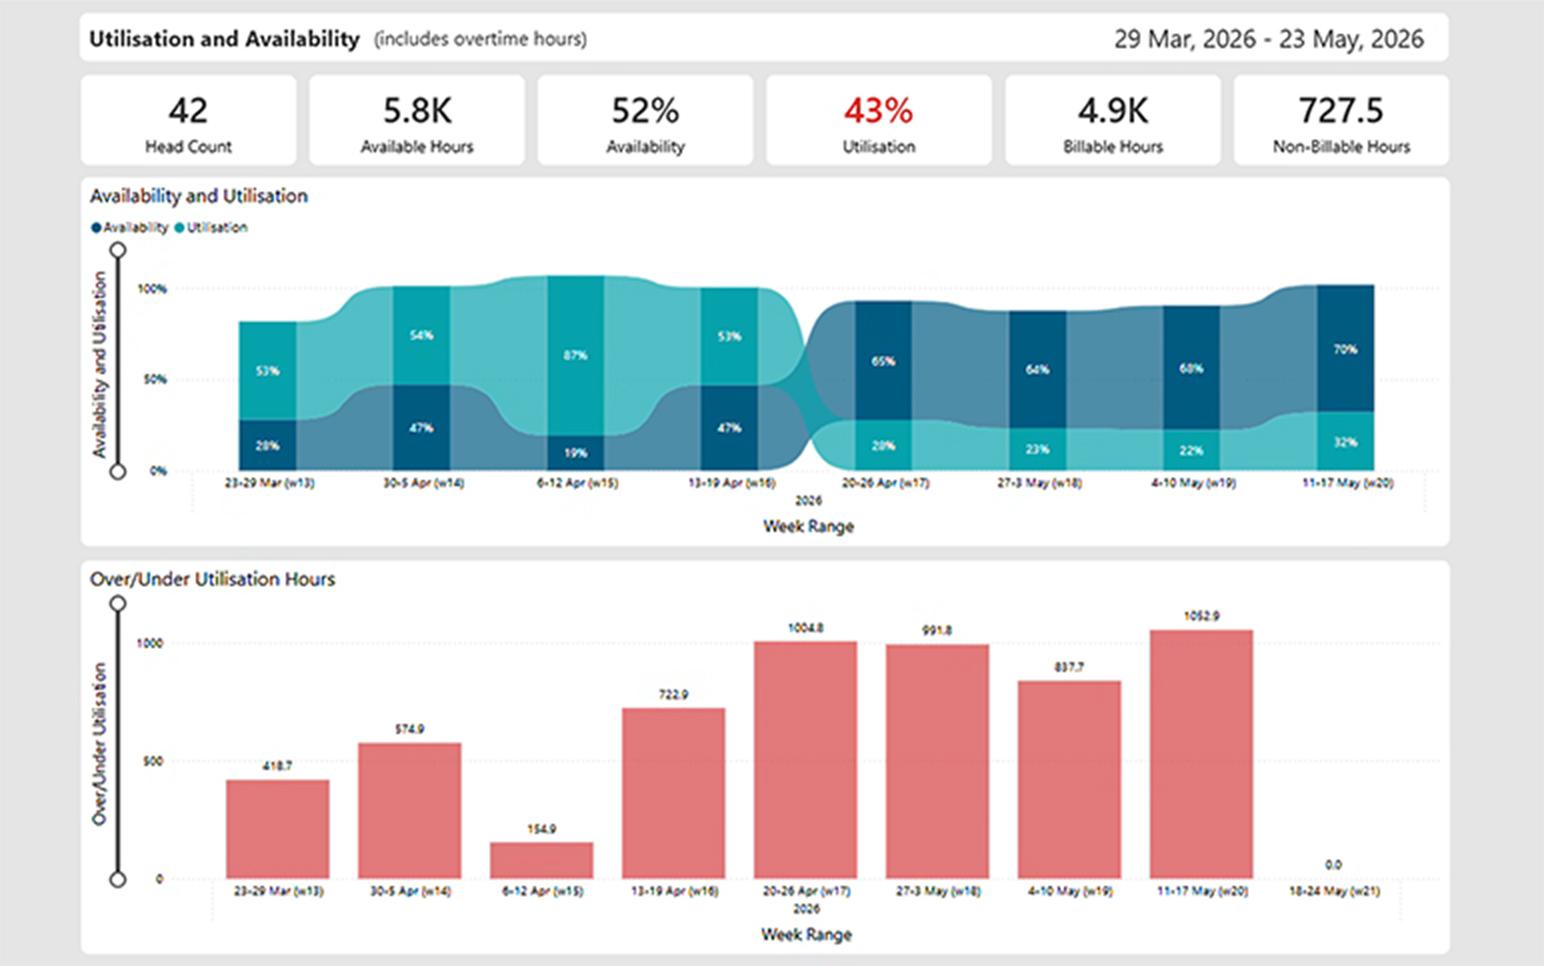
Monitor utilisation across teams
Utilisation dashboards provide visibility into how effectively talent capacity is being used across the organisation. Leadership teams can monitor workload distribution, identify unused capacity and ensure resources are allocated efficiently across projects.
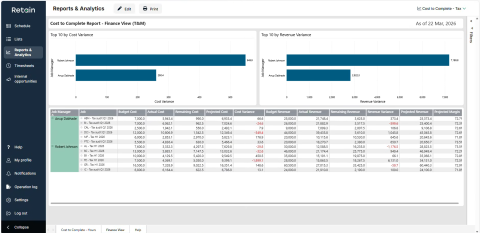
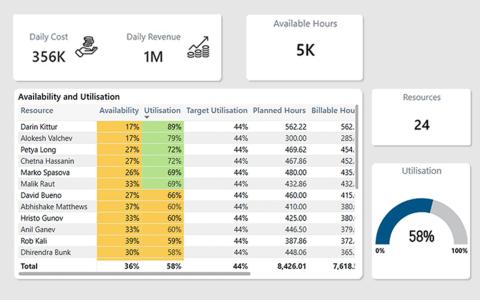
Forecast revenue and delivery costs
Retain connects planning data with financial forecasting to help organisations analyse projected revenue and delivery costs across projects. These insights allow organisations to understand the financial implications of resource allocation decisions.
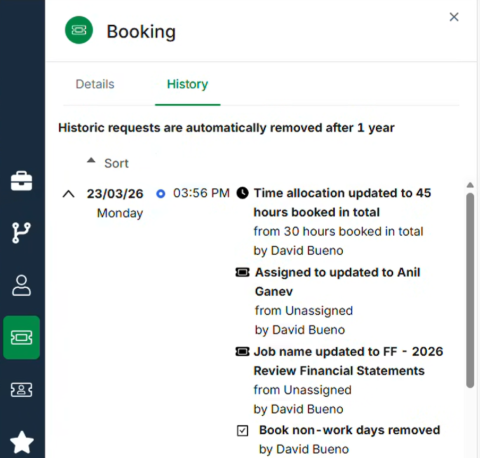
Maintain operational visibility through notifications and audit logs
Operational notifications inform teams when bookings or roles change, while audit logs provide a full history of system activity. These capabilities ensure organisations maintain accountability across operational planning processes.
Business Impact
Integrated reporting enables organisations to understand operational performance and make better resource management decisions. By connecting planning data with analytics dashboards, leadership teams gain visibility into utilisation, delivery performance and financial outcomes.
Organisations can:


Book Your Demo Today
See how Retain helps you improve utilisation, plan projects with confidence, and deliver work more efficiently.
What is resource management reporting and analytics?
Resource management reporting provides organisations with insights into how talent is allocated across projects, how effectively capacity is used and how delivery performance impacts financial outcomes. Analytics dashboards allow organisations to monitor utilisation, track project costs and forecast revenue using operational planning data.
FAQs
Users can view bookings, review job details and receive notifications about operational planning changes.
Yes. Information synchronises automatically between the mobile application and the Retain platform when connected to the internet.
Retain reporting provides insights into utilisation, project performance and financial forecasting.
Yes. Utilisation dashboards allow organisations to monitor workload distribution across teams.
Yes. Retain connects resource planning data with revenue and cost forecasting insights.
Reporting dashboards refresh using operational planning data captured within the platform.
Yes. Notifications and audit logs provide visibility into changes across bookings and roles.
Yes. Analytics dashboards provide leadership teams with operational insights across departments.